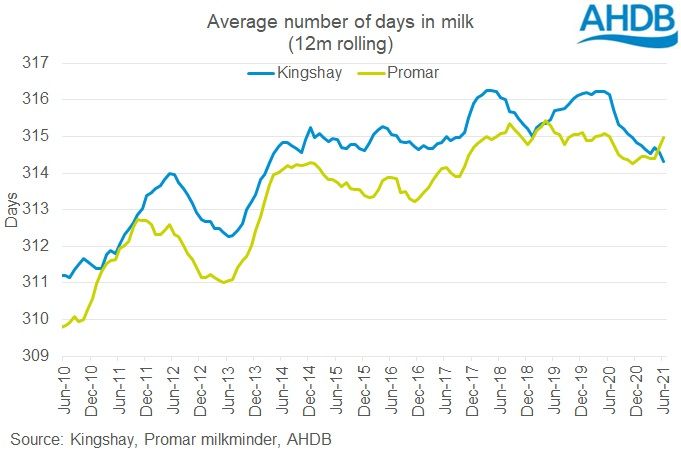


Our estimates based on Kingshay data have been trending downwards since June 2020. Efforts to curb milk production are likely to have played a role in this, as drying cows off earlier is one way to achieve lower production. As the data uses a twelve month rolling average, it will impact the figures for a while after the initial period of action is over. However, our estimates based on the Promar data have a much less decisive trend. Although there is also a dip from June 2020, it is less steep and has since recovered. This difference between the two will be down to the specific mix of farms included in each company’s datasets.
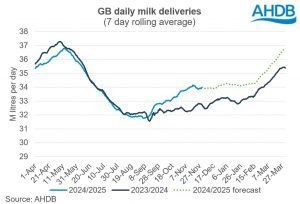
How much does this impact milk production?
We discussed this topic at the latest Milk Forecasting Forum. It was mentioned that another thing that might influence the average days in milk is the calving system a farm is using. For a block calving farm, in order to maintain a strict block, cows would need to be dried off on schedule. The average days in milk for a block calving farm would, theoretically be around 305 days. As this is lower than the current overall average, a substantial shift to block calving, would drop the average days in milk, and may impact production. However, it was also noted that for all-year-round herds, improvements in conception rates will mean cows getting back into calf sooner, and therefore being dried off sooner. At the moment, there are far more AYR herds than block herds in GB.
If we add GB milk production to the graph, we can see that there is correlation between production and days in milk – though it is weaker in more recent years. This implies that it is a factor to consider, but not the only one. This will be true at both the national and farm level.

[1]We estimated the average number of days in milk based on Kingshay and Promar data. We took 12-month rolling averages of the proportion of cows in milk, and multiplied it by the number of days in a year (cows in milk ÷ total cows in herd x 365).